
Tramex Meters App - How to create a moisture map
Hi, and welcome to Tramex.
In this video, we're going to demonstrate how to build a simple moisture map of a surface and report your results.
To create a Tramex moisture map you will need the Tramex meters App. It's simple to set up, check out our Getting Started video.
To make a moisture map, ensure you are online, open moisture mapping in the Tramex Meters App, and create a new report. Reports are a collection of one or more moisture maps allowing you to group moisture maps of walls, floors, ceilings, or flat roofs in one place.
Enter your report name and location. If you're on-site and you don't know your current address, then tap the geotag icon and your location will be found.. & hit create.
Now add the first surface to your report. You can have as many surfaces as you like, just give your surface a name and tap the icon to select or take a photo. The image will become the background of your surface map. You can save a plan drawing of a floor in your phone's photos or just take a picture there and then.
Now that we're all set up, let's start adding readings with your meter switch on your Tramex Meter and ensure that Bluetooth is enabled.
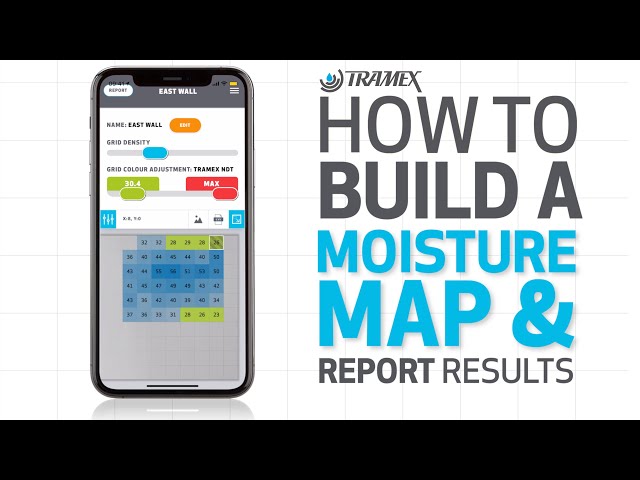
Select the devices button and choose your meter from the list. Choose the cell you want to start with on your grid. Now it's time to take your measurement and when you're ready to save, just tap on your device reading to fill up the grid. You can select your cells by tapping them or to save yourself time, you can swipe on your device reading. The cell selection moves in the direction that you swipe. It's pretty quick to enter readings but if you find you need more detail in particular areas because you found moisture, you can adjust the grid density at any time and enter more readings into the grid. If you would like to navigate your grid with a bit more space, you can make it fullscreen.
When you've entered your readings, you may like to highlight the lowest and or highest readings in the grid by modifying the grid color adjustment thresholds. This acts like a traffic light system so that your readings are easier to interpret and when your surface is complete, you can export the image for a list of readings by hitting one of the buttons above.
And finally, because this is the Tramex Cloud System, you can open this surface report in your browser on any device - laptop, tablet, whatever!
Thanks for watching, reach out to us if you have any issues or suggestions.